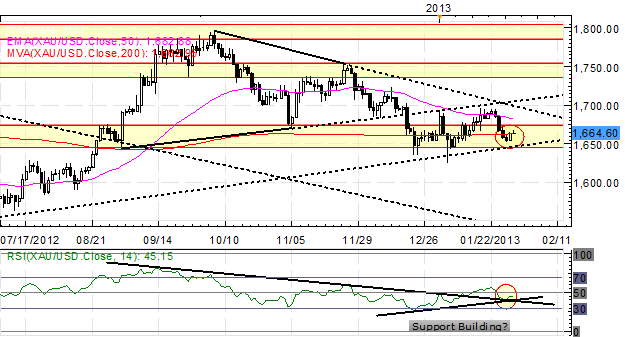
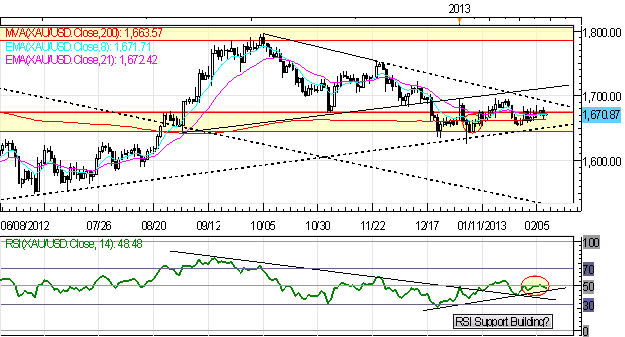
Gold Price Climbs after GDP Report, Fed Meeting

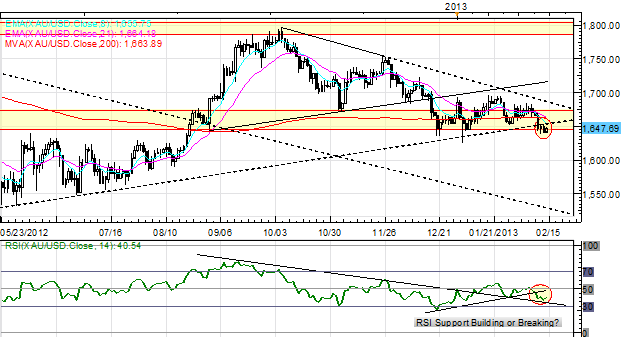
GOLD PRICE NEWS – The gold price turned higher on Wednesday after a disappointing U.S. GDP report and maintained its gains following the latest Federal Reserve meeting. The spot price of gold advanced to an intra-day high of $1,682.87 per ounce before settling up by $12.84, or 0.8%, at the $1,676.07 level. Gold prices were also boosted by weakness in the U.S. Dollar Index (DXY), which fell by 0.4% to 79.258 against a basket of the world’s most-traded currencies.
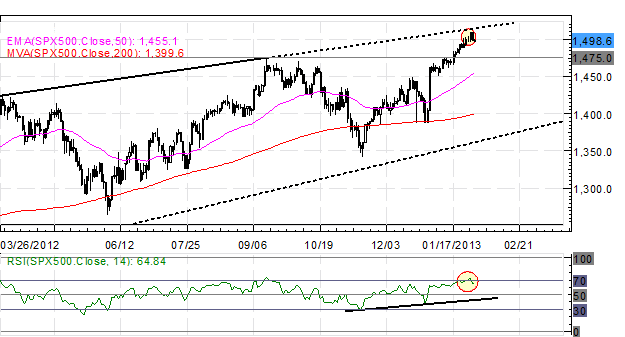
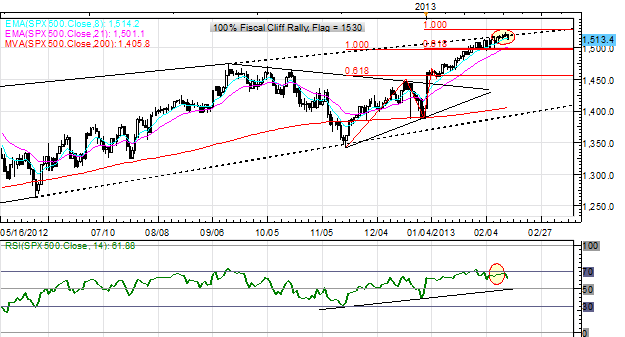
Silver outperformed the price of gold, as it jumped by $0.68, or 2.2%, to $32.06 per ounce. Gold and silver stocks initially rallied alongside precious metals, but later turned south in conjunction with the broader equity markets. The Philadelphia Gold & Silver Index (XAU) closed lower by 0.5% at 150.95 while the S&P 500 Index slid by 0.4% to 1,501.96.
Among widely-traded gold stocks, notable decliners included XAU components Barrick Gold (ABX), Goldcorp (GG), and IAMGOLD (IAG). Shares of ABX dropped by 1.3% to $32.39, GG by 0.4% to $35.94, and IAG by 2.6% to $8.27.
The price of gold held steady in early morning trading, but surged higher after the latest U.S. GDP report showed that the nation’s economy contracted by 0.1% in the fourth quarter of 2012. The negative reading was the first of its kind since the third quarter of 2009, and well below the 1.1% consensus estimate among economists.
Later on in the day, Federal Reserve Chairman Ben Bernanke and his peers on the Federal Open Market Committee (FOMC) decided to stand pat with their set of accommodative monetary policies. Specifically, the Fed chose to maintain its quantitative easing program at $85 billion per month and reiterated its 6.5% unemployment rate threshold with respect to eventually raising the Federal Funds rate.
Commenting on the outlook for the price of gold in light of today’s events, analysts at Standard Bank wrote in a note to clients that “We feel it is important to note that the Fed’s balance sheet is only one piece in a puzzle of growing liquidity and negative real interest rates…Strategically we remain bullish on gold over the long term. The cost of holding gold relative to cash remains negligible.”
GOLD PRICE NEWS – The gold price turned higher on Wednesday after a disappointing U.S. GDP report and maintained its gains following the latest Federal Reserve meeting. The spot price of gold advanced to an intra-day high of $1,682.87 per ounce before settling up by $12.84, or 0.8%, at the $1,676.07 level. Gold prices were also boosted by weakness in the U.S. Dollar Index (DXY), which fell by 0.4% to 79.258 against a basket of the world’s most-traded currencies.
Silver outperformed the price of gold, as it jumped by $0.68, or 2.2%, to $32.06 per ounce. Gold and silver stocks initially rallied alongside precious metals, but later turned south in conjunction with the broader equity markets. The Philadelphia Gold & Silver Index (XAU) closed lower by 0.5% at 150.95 while the S&P 500 Index slid by 0.4% to 1,501.96.
Among widely-traded gold stocks, notable decliners included XAU components Barrick Gold (ABX), Goldcorp (GG), and IAMGOLD (IAG). Shares of ABX dropped by 1.3% to $32.39, GG by 0.4% to $35.94, and IAG by 2.6% to $8.27.
The price of gold held steady in early morning trading, but surged higher after the latest U.S. GDP report showed that the nation’s economy contracted by 0.1% in the fourth quarter of 2012. The negative reading was the first of its kind since the third quarter of 2009, and well below the 1.1% consensus estimate among economists.
Later on in the day, Federal Reserve Chairman Ben Bernanke and his peers on the Federal Open Market Committee (FOMC) decided to stand pat with their set of accommodative monetary policies. Specifically, the Fed chose to maintain its quantitative easing program at $85 billion per month and reiterated its 6.5% unemployment rate threshold with respect to eventually raising the Federal Funds rate.
Commenting on the outlook for the price of gold in light of today’s events, analysts at Standard Bank wrote in a note to clients that “We feel it is important to note that the Fed’s balance sheet is only one piece in a puzzle of growing liquidity and negative real interest rates…Strategically we remain bullish on gold over the long term. The cost of holding gold relative to cash remains negligible.”